Technology5 min read
The stories we tell about crypto cycles
Four halvings and four bubbles as I remember them, plus why I think the halving story is too neat.
The first Bitcoin halving happened on 28 November 2012. The block reward dropped from 50 coins to 25, and the price was somewhere around 12 dollars. I was around for it, in the sense that I was reading about it and not doing much else.
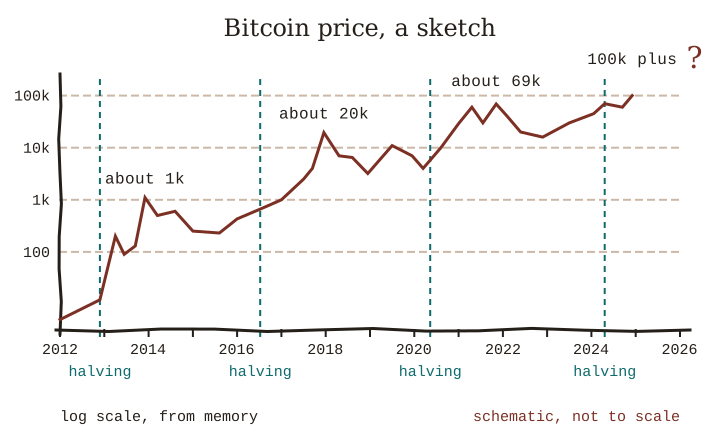
Since then there have been three more halvings and, depending on how you count, four big cycles. Here’s the shape of it as I remember it. The chart is a sketch from memory, so please don’t trade on it.
2012 to 2015
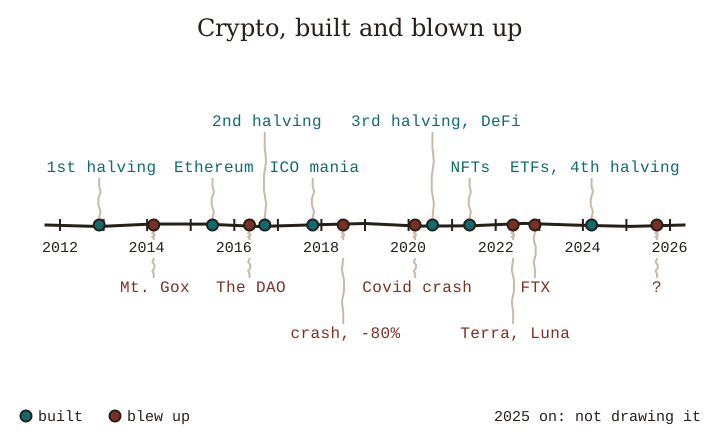
2013 was the first run I’d call a proper mania. Cyprus froze bank accounts in March, Bitcoin suddenly had a story, and by late November it went past 1,000 dollars. Mt. Gox was a huge part of that market. Then in early 2014 Mt. Gox stopped withdrawals and collapsed, with something like 850,000 coins reported missing. A chunk of them turned up later. The rest didn’t.
2014 and 2015 were long and boring and, looking back, the years when the interesting things got built. Ethereum launched on 30 July 2015. Smart contracts, which meant a chain you could program, and nobody quite knew what to use that for yet.
2016 to 2019
Second halving, July 2016. A few weeks earlier The DAO had been drained through a bug in its own contract, and that same July Ethereum hard-forked to undo it, which people still argue about.
Then 2017. ICOs. Anyone with a white paper and a Telegram group could raise tens of millions in an afternoon, and a lot of them did. Bitcoin went from around 1,000 dollars in January to somewhere between 19,000 and 20,000 in December. CME listed futures that same month, which some people took as the top signal, and for once they were right.
2018 was the hangover. Down more than 80 percent by December. Many ICO tokens lost nearly all their value. I think this was the cycle that taught a lot of people that a token is not a company, and that “utility” in a white paper is not utility.
2019 was quiet. Nobody writes about the quiet years but they’re most of the timeline.
2020 to 2022
March 2020, the Covid crash, when Bitcoin lost roughly half its value in two days along with everything else. So much for the uncorrelated asset. Then the third halving in May, and by summer it was “DeFi summer”: lending pools, automated market makers, yield farming, tokens named after food. Some of it was real plumbing. A lot of it was a ponzi with a nicer front end.
The dollar amounts in 2021 were hard to take in. A Beeple collage sold at Christie’s for about 69 million in March and suddenly everyone had a monkey picture. Bitcoin hit about 69,000 dollars in November. China banned mining that year and the network shrugged it off within a few months, which I still find quite impressive.
2022 was the collapse, in stages. Terra and Luna in May, an algorithmic stablecoin that stopped being stable and took tens of billions with it. Then the lenders and funds that had been leaning on it. Then FTX in November, which was old-fashioned fraud with a new logo. The price ended the year somewhere around 16,000 dollars.
2023 to 2026
2023 was another quiet year. In January 2024 the US approved spot Bitcoin ETFs, which gave investors a way to buy exposure through a brokerage account. The fourth halving came in April 2024. In December 2024 Bitcoin went past 100,000 dollars.
For 2025 and 2026 I’m going to be vague on purpose. Prices move, the cycle story gets retold, and anything I write here will look silly by the time you read it. As I write this in September 2026 the pattern people talk about is the same one they talked about in 2017.
The halving story is too neat
Here’s my opinion. The tidy version goes: halving cuts new supply, price rises a year or so later, peak, crash, repeat every four years. I see people fit almost every price move into that story.
But look at what actually sat next to each peak. In 2013 it was one exchange with no controls. In 2017 it was ICOs. In 2021 it was zero interest rates and stimulus money. In 2024 it was the ETFs. Each time the halving was there, and each time something much bigger was also there. Cutting the daily new supply from 900 coins to 450 is small next to a pension fund deciding to put half a percent in.
I think the halving works as a calendar. It tells everyone when to start paying attention again, and paying attention is what moves the price. That’s still a real effect. It’s just a social one, and social effects stop working the moment enough people expect them.
Four cycles in, I’ve stopped predicting tops. I ignore the charts most of the year and I try not to explain any of this at dinner.